Remote C/C++ Debugging with VSCode
This article is old and an updated article exists at https://tipspiggy.blogspot.com/2022/05/remote-cc-debugging-with-vscode-1.html .
You can use VSCode or VSCode Insider for C/C++ remote debugging. But I recommand you use VSCode Insider.
Be Careful : At the present time(2019.10), this article does not apply to Raspberry Pi, Jetson Nano those are based on ARM CPU.
I'm going to use a X64 based Ubuntu 18.04 remote server.
Prerequisite
Before you setup a remote c/c++ development environment, install c/c++ build tools on the remote server.sudo yum install gcc gcc-c++ make gdb
Installation
Do the same steps as in my article.
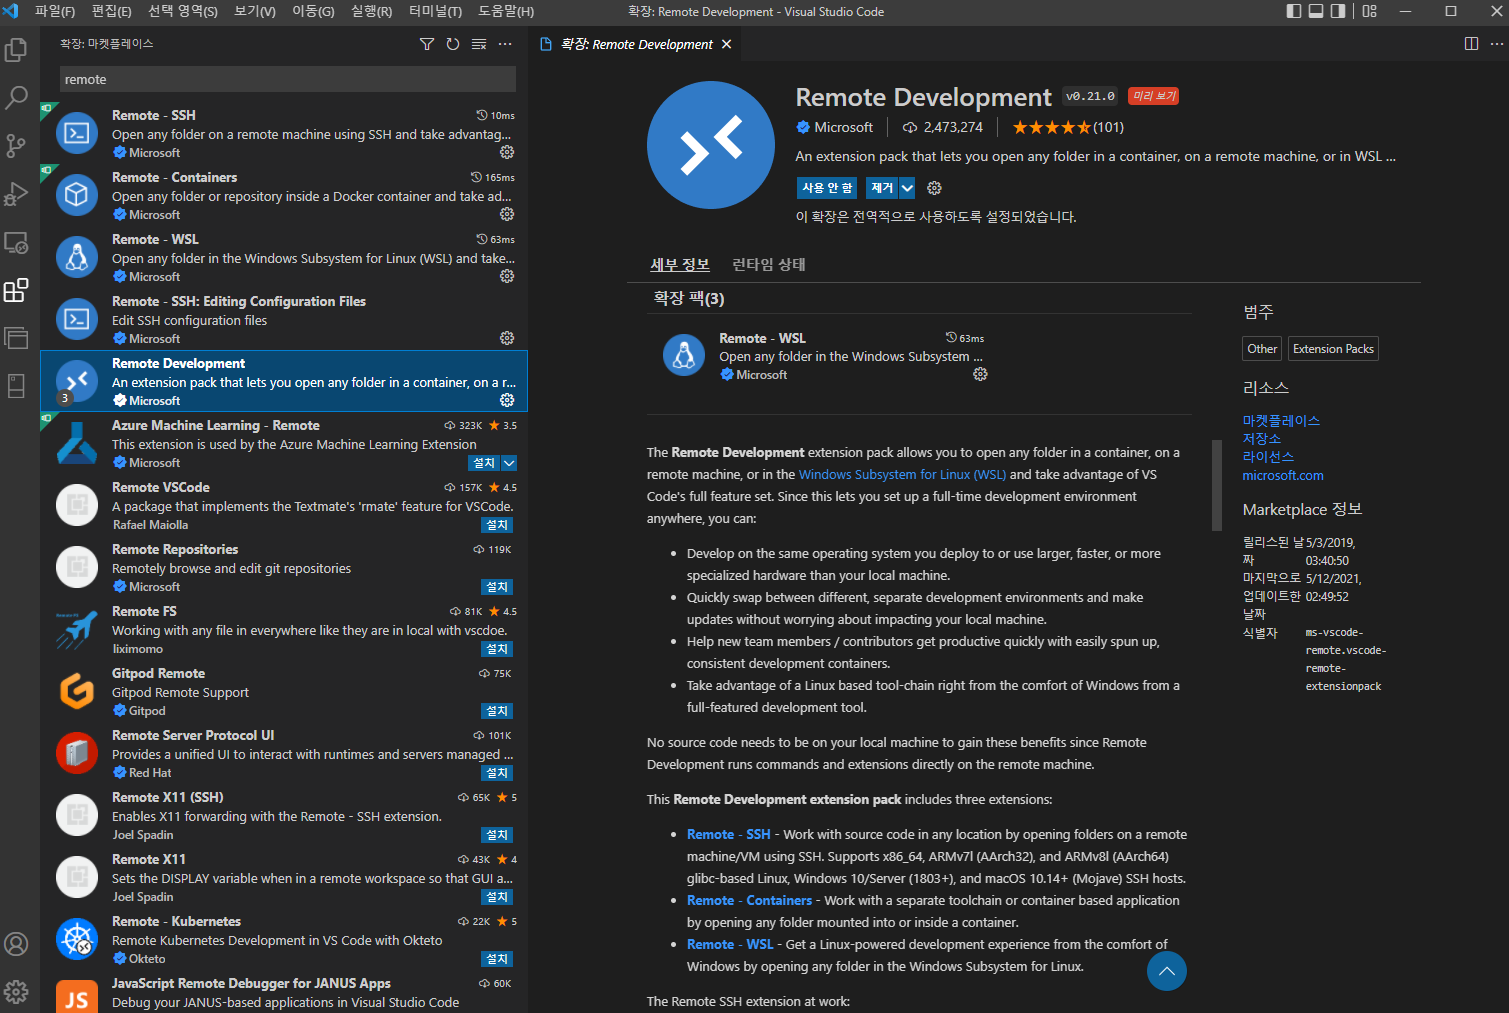
From now on, I will assume that you have installed three packages(VSCode, Remote Development Extension, Python Extension). And Remote SSH connection setup is completed.
Install C/C++ Extension
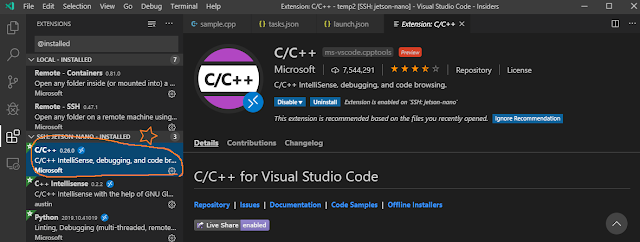
Search for and install the C/C++ extension.After connecting to the remote server, you can see that C/C++ extension has a new button (Install in SSH:Ubuntu-server). Click the button and install C/C++ extension to the remote server. Then Relaod the VSCode workspace. Then the C/C++ extension will change like this.
Open Remote Folder
If you press the Explorer button and then the Open Folder button, you can specify the working directory. I opened /usr/local/src/test directory.I made 2 cpp files.
#include <stdio.h>
#include <stdlib.h>
#include <iostream>

int hello();
int main(int argc, char *argv[])
{
  int a = 4;
  int b = 10;
  int c = a + b;

  printf("sum:%d\n", c);
  std::cout << "sum:" <<c << std::endl;
  hello();
  return 0;
}
<debug.cpp>
#include <stdio.h>
#include <stdlib.h>
#include <iostream>

int hello()
{
    std::cout << "hello!" << std::endl;
    return 0;
}
<hello.cpp>
Perhaps the build command might be like this.
g++ hello.cpp debug.cpp -o myout
build and debugging
for C/C++projects to build and debug, we need 2 more files. One is launch.json, the other is tasks.json.Build
For building, we need to compile above c++ files, then link object files, make output executable.For this purpose, we should make tasks.json file first.
First make .vscode directory under the current directory
mkdir .vscode
cd .vscode
vim tasks.json
tasks.json file looks like this. It is very similar to the build command described earlier.
{
    "version": "2.0.0",
    "tasks": [
        {
            "label": "save and compile for C++",
            "command": "g++",
            "args": [
                "-g3",
                "hello.cpp", "debug.cpp",
                "-std=c++11",
                "-o",
                "${workspaceFolder}/myout"
            ],
            "group": "build"
        }
    ]
}
<tasks.json>
Press Ctrl + Shift + B for build the above project. Select "save and compile for c++". Once more select "Continue without scanning the task output".
If successful, you can see a executable file "myout".
We finished c/c++ project building. Now let's debug the program.
debug
For debugging, you need another json file launch.json under .vscode directory. It looks like this.{ "version": "0.2.0", "configurations": [ { "name": "(gdb) start", "type": "cppdbg", "request": "launch", "program": "${workspaceFolder}/myout", "args": [], "stopAtEntry": false, "cwd": "${workspaceFolder}", "environment": [], "externalConsole": false, "MIMode": "gdb", "setupCommands": [ { "description": "gdb에 자동 서식 지정 사용", "text": "-enable-pretty-printing", "ignoreFailures": true } ] }, null ] }
<launch.json>
Make a breakpoint where you want to set by mouse clicking left the line numbers.
Then press F5(Start debugging).
If successful, the program executes and stops at the breakpoint like this.
You can see the variables at this point, and can step over to the next line. The debugger menu can be found at the top of the screen.


댓글
댓글 쓰기