Remote C/C++ Debugging with VSCode #1 - Installation and simple debugging
Previously, I wrote an article about C++ debugging of remote Linux systems in VSCode, but it seems that it is time to change the contents after about 3 years have passed.
VSCode has been greatly improved over the past time and the remote debugging feature has also become much easier to use. There is little difference from debugging on the local system.
This explanation assumes that VSCode is installed on your computer. For reference, I used CentOS 7 installed on VMWare Workstation as a remote Linux server. There is probably no difference in usage even if you use a different distribution such as Ubuntu.
Install extension for remote development
Remote Development Extension
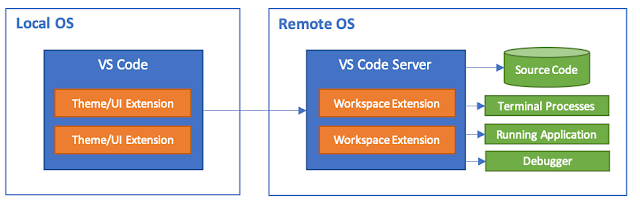
First, install the extension for remote development in your VSCode. Search for "Remote Development" in VSCode and install "Remote Development" made by Microsoft. This extension installs Remote - SSH, Remote - Containers, Remote - WSL. Among them, Remote-SSH will be mainly used.

Remote SSH Configuration
After installing the "Remote Development" extension, proceed with the settings for remote computer access in VSCode. First, boot the remote Linux system and check the connection using an ssh program such as putty.
This is a picture of a successful connection to the remote Linux system (192.168.219.106) using the ssh client.
[C:\~]$ ssh root@192.168.219.106


Connecting to 192.168.219.106:22...
Connection established.
To escape to local shell, press 'Ctrl+Alt+]'.

WARNING! The remote SSH server rejected X11 forwarding request.
Last login: Sat May 14 01:15:49 2022 from 192.168.219.103
[root@zabbix-server ~]#
If the connection does not work well, check the firewall settings and whether the ssh service on the Linux system is working again.
Now in VSCode press Ctrl+Shift+P. Then select "Remote-SSH:Connect to Host/Configure SSH Hosts..." using the Remote keyword.

And select the config file. If you select the config file for the current user at the top, it's fine.

Enter and save remote Linux system access information as follows.
Host Zabbix-H323_packet
    HostName 192.168.219.106
    User root
Now press Ctrl + Shift + P again and select "Remote-SSH:Connect to Hosts...", and the remote Linux server information you just created will appear. If you click this item, you can connect to the remote Linux system by ssh.

During the connection process, you will be asked to enter the OS and password of the remote system. If you entered it correctly without any errors, a new window will open and you will be connected to the remote Linux system. In the lower left corner of the figure below, information about the connected Linux system is displayed.

Install C++ Extension Pack on remote system
Now that you have connected to the remote Linux system, it is time to install the C++ extensions on the remote system. In the VSCode Extension Management tab, search for C/C++ and install the C/C++ Extension Pack on the remote Linux system. This extension will help you manage and debug C/C++ code on remote Linux systems in VSCode.

Create a project directory
You are now ready for remote debugging. Pressing the Terminal/New Terminal menu in VSCode opens a new ssh terminal at the bottom of the screen. Create the directory you want to work in this terminal beforehand. I'm going to create a directory /usr/locla/src/study/hello.

Click OpenFolder in VSCode Explorer and select the directory /usr/locla/src/study/hello you just created. VSCode will now create and edit files in the /usr/locla/src/study/hello directory of the remote Linux system.

Create a project file(cpp)
Now, let's create a sample source code to be used for remote debugging. Click the New File button to create a hello.cpp file.

Create a file with the following simple contents:
#include <iostream>

int main()
{
    int a = 1;
    int b = 2;
    int c = a + b;
    std::cout << c << std::endl;
    return 0;
}
And compile in the terminal. There are a few things to note when compiling. Since you will be debugging, you must include the -g option. If this option is omitted, gdb will not work later because it is built in release mode.
[root@zabbix-server hello]# g++ -g hello.cpp
[root@zabbix-server hello]# ls -al
total 24
drwxr-xr-x 2 root root    36 May 14 04:39 .
drwxr-xr-x 8 root root    91 May 14 04:24 ..
-rwxr-xr-x 1 root root 19584 May 14 04:39 a.out
-rw-r--r-- 1 root root   132 May 14 04:39 hello.cpp
[root@zabbix-server hello]# ./a.out
3
[root@zabbix-server hello]#
You can see that it is built well. Now it's debugging time. But there is still one work left. Information for debugging needs to be written, and this is done in the "Run/Add Configurations..." menu of VSCode. When this menu is selected, the build environment is selected as shown in the figure below. Select C++ (GDB/LLDB).


{
    // Use IntelliSense to learn about possible attributes.
    // Hover to view descriptions of existing attributes.
    // For more information, visit: https://go.microsoft.com/fwlink/?linkid=830387
    "version": "0.2.0",
    "configurations": [
        {
            "name": "gdb - Build and Debug",
            "type": "cppdbg",
            "request": "launch",
            "program": "${workspaceRoot}/a.out",
            "args": ["1", "2"],
            "stopAtEntry": false,
            "cwd": "${workspaceFolder}",
            "environment": [],
            "externalConsole": false,
            "MIMode": "gdb",
            "preLaunchTask":""

        }
    ]
}
Now it's really debugging time.
Specify a breakpoint and press the green debug button to start debugging.


Wrapping up
As VSCode's remote debugging function improves, you can easily work with little difference from debugging on a local system. In this article, we proceeded to install and configure extensions for remote debugging.
Once connected to the remote system, it can be easily accessed using Remote Explorer from the next time. In Remote Explorer, there are remote systems and directories that you have accessed previously, and you can easily open up to that directory at once by selecting the desired connection here.

And I debugged using a very simple example. In the next article, I will introduce how to provide execution parameters for debugging, and how to use the Makefile together.
댓글
댓글 쓰기